Part IV - The Step Model and Footfall Plots
- Introduction
- The Standard Model
- Test Step Model
- Creating Footfall Plots
- Plotting Results
- Plotting Results Analyses
- Step-line
- Stride-line
- R/L-line
- Walking-straddle
- Etc., etc.
1. Introduction
The Step Model geometrically displays the critical measures and rotation
points needed for the creation of realistic footfall patterns.
It
exactly defines foot placement, not the real movement of any body segment
during a step, and organizes the distance and direction relationships for
the 4 minimum points of gait and foot-line, at the instant of heel-contact.
Each Step Model defines a 2D step-plane. The orientation of this plane
is arbitrary. Sequential planes are related since the step-heel-point in the
current plane is the same as the start-heel-point in the next.
Direction changes during a step are described by 4 of the fundamental
parameters:
1) aberrations
2) push-off angle
3) and 4) foot angle
and foot offset.
They are all accounted for by rotating the whole
model, then aligning the appropriate heel-point. The side-step nature of
foot offset is built into the model, and doesn't need extra treatment. If
there's an aberration, the whole model is rotated for the rotation part, and
then the model's start heel-point aligned with the end heel-point of the
aberration.
The circle for the head (COM, more or less) doesn't
represent the real position of the head, it's just to help visualize. And,
hip joint architecture may introduce a minor variation in the step-out arc
characteristics, but that's left off for now.
2. The Standard Model
These are the values for
the standard model, and are the minimum number of measurements needed.
Step-out-line = 15”
Pelvic stretch = 0"
Rear-leg-line = 15”
Straddle-line = 8”
Unfortunately, literature walking base
measurements can't be used to estimate straddle-line. Walking base changes
with angular changes in the body DOT (even if walking straight), but
straddle-line doesn’t, so the two aren’t comparable, even though they're
related. Walking straddle is walking base, but measured at the heel-points
instead of the point of contact of the heel. For str8, Wstr varies as shown
below.
| Walking Straddle |
| L15{0}[15] str8 and
R15{0}[[15] str8 |
8.00 |
- walking straight, no turns, walking
straddle (Wstr) = straddle-line (str) |
| L15{0}[15]str8:L10R and
R15{0}[15]str8:R10L |
10.57 |
- walking straight, both feet 10 deg
internal turns, Wstr > str |
| L15{0}[15] str8:L10L
and R15{0}[15]str8:R10R |
5.35 |
- walking straight, both feet 10 deg
external turns, Wstr < str |
For the standard model, I also include the foot models to make analyzing
the plot more intuitive, but it isn’t required. I could just as easily be
using a dot or cross, since the heel point position is the only thing that
matters for distance and direction. But adding the foot model is very easy
to do and gives a much more realistic graphic representation. It also makes
it possible to see body DOT relationships, and much easier to see plotting
errors, distance relationships, and characteristics derived from plot
overlays.
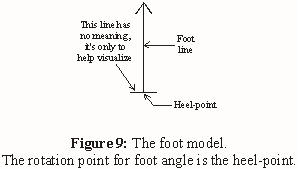
Foot model length = 8”, measured from the heel-point (which is the
rotation point for foot angle) to the tip of the toe, along the foot-line.
The horizontal line is 2” and is only to help visualize.
Gray
step-foot models represent footprints, and black reference-foot models
indicate a foot in the air, or some other standard reference.
When
the straight foot angle is 0 deg, so there's no push-off angle, as in all
the plots so far, the step-foot-line is parallel to the rear-leg-line of the
other foot's next step.
Group the horizontal line and foot-line, and
change the rotation point to the heel-point.
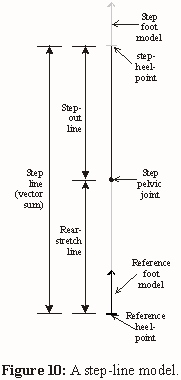
Group the step-out-line and the step-foot model and change the rotation
point to the bottom of the step-out-line (The rotation point for foot offset
is the step-pelvic joint, which is the bottom of the step-out-line.). Then
group this figure with the rear-stretch-line and reference-foot model.
Complete the figure as shown in Fig.10.
Group the whole thing
after it’s built.
3. Test Step Model
When applied to real data,
each step would have a unique model constructed from the data points.
For standard plots, though, it's easier to have just one. Luckily, the
left and right steps can be put into one, even if each has different
step-out and rear-leg lines, as well as independent foot angles and offsets,
push-off angle and aberrations. As long as the straddle-lines are the same,
which means the same pelvic-stretch.
If the notation for a Step Model
has no reference to the other foot, it's for only one step. Eg.
L15{0}[15]str8:L(5)R-10R shows only the parameters for the left step. In
this model, the right step-line has no foot angle or offset, is dimensioned
the same as the left, and is only to help visualize.
L15{0}[15]R15{0}[15]str8:L10L represents both steps, with only the left
showing a direction change.
So far, I've kept the straddle-line
constant in all plots, and include both steps on a single model.
Foot offset / Leg angle Calculations:
The linear
value of foot offset is difficult to use, though it may be easier to
visualize. Luckily, this can be converted to leg angle, if the step-out-line
is known.
At the instant of heel-contact, if you could freeze
yourself in space, just before you plant the front foot, you could move the
foot from side to side, and, with constant step-out-line, its path would
describe an arc, the step-out-arc.
Step-out-line = radius of the step-out-arc = r = 15”
If you could spin your leg all the way around, the step-out-line would be
the radius of a circle,. Since r is known, the circumference of the circle
can be calculated.
circumference of step-out-circle = 2 (pi) r
=2
(3.14)15.0”
=94.2”
and,
360.0 deg leg angle / 94.2"
foot offset
= 3.82 deg leg angle / " foot offset
or,
0.26” foot offset / deg leg angle
So, if the foot moves 1” along the arc, that’s a leg angle of 3.82 deg,
and a leg angle of 1 deg is a 0.26" (along the arc) foot offset. It's much
easier to refer to foot offset as deg leg angle, eg. (10)L.
Changes
to the standard model change it's overall dimensions, making it more
difficult to accurately place (if you want to also use a stationary line or
point as a reference), so set up a standard page with the standard step
model already positioned on the start. Somewhere on the page, add a blank
table to record the distance values from the dimension lines, and a box with
the line description of the sample Step Model values.
When changes to
the standard model are complete, copy and paste, and leave the copy on the
other side of the page for posterity.
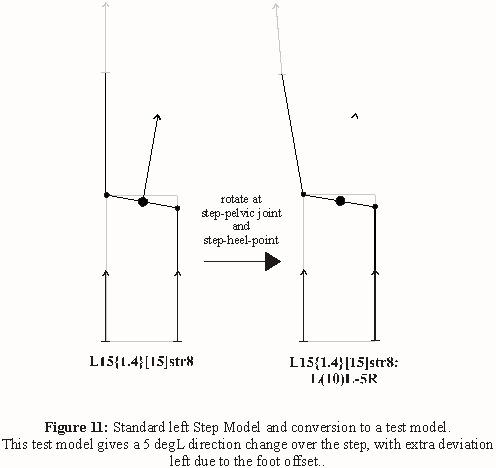
For L(3)L-2L:R5R (this person
would have equal left and right stride measurements, but the path would have
an extra shift left at every left step):
- Select the standard Step Model and ungroup.
- Select the left step-out-line/foot model and rotate 3 deg CCW.
- Ungroup the left step-out-line/foot model, then select the left
step-foot model.
- Rotate 2 deg CCW.
- Select the right step-out-line/foot model and ungroup.
- Select the right step-foot model and rotate 5 deg CW.
- Select entire figure, then group.
- Copy and paste, then move the copy to the other side of the page.
This one is kept on the page as an example of the sample model, in case
there are errors.
That’s all there is to it, you’re ready to plot. The model is already
positioned correctly at the start if you used the standard page.
Foot
offset is built into the model. Foot, push-off and leg angle rotations are
done when plotting.
4. Creating Footfall Plots
- Start with the standard page and modify the standard Step Model.
- Copy and paste the test Step Model and move the copy off the
original to keep.
- Copy and paste the test model again. This will be for the first left
step.
- Move the copy off the original, and rotate for the left foot offset
and angle and push-off angle. For L(3)L-2L:R5R, rotate 5 deg CCW.
- Align the left start-heel-point on the copy with the left
step-heel-point of the last model.
- Copy and paste this model, then move the copy off the original.
- Rotate the copy for right foot angles, offsets etc., 5 deg CW, then
align the right start-heel-point with the last model's right
step-heel-point.
- Copy, paste, and move the copy off the original and rotate, etc.,
for as many steps as you like.
- Copy and paste the entire path figure with models, and move to a
reference page. Make sure to keep its line description with it. Footfall
patterns look alike without the descriptions.
- Go back and select the first model. By ungrouping and deselecting
lines and points, you can drop any reference figures you want. For the
first, I drop the step-foot model (the left), start-foot model, trunk
direction, pelvis-line and head dot. Delete the rest of the figure.
- Select the next model. Ungroup and deselect the reference-foot model
(for right step and carry measures), the step-foot model, trunk
direction, pelvis line and head dot. Delete the rest of the figure.
- Select the next model. Ungroup and deselect the step-foot model,
reference-foot model (for left step and carry measures), trunk
direction, pelvis-line and head dot. Delete the rest of the figure.
- Select the next model. From here on, drop the trunk direction,
pelvis-line and head dot, and the foot model of interest. (The right for
this one, left for the next, etc.) For recreating a real path, the
reference-foot models would be dropped for every step as well, not just
the first two. Also, other reference points and/or lines can be added to
the original model and dropped at each step.
- Continue until you get tired of it.
I use 7 models, including the first one. This is to help recognize
plotting error. For example, if the right strides aren't the same length,
there's been an error. Theoretically, they should be identical.
Throughout the entire sequence, "outside" points or lines can be dropped to
see the variations in these factors.
Plots can be made with any
number of steps to see even broader patterns, if desired, or a different
type of test Step Model for each step. Because the start footfall position
is always known, any type of Step Model could be inserted into the pathway,
as long as it starts at the proper orientation. This is one of the many
advantages of this method.
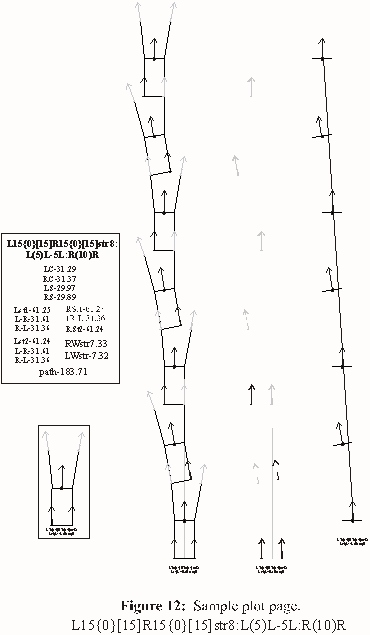
The black footfalls represent a foot in the air at the reference
position, and are used to define the left and right carry measurements.
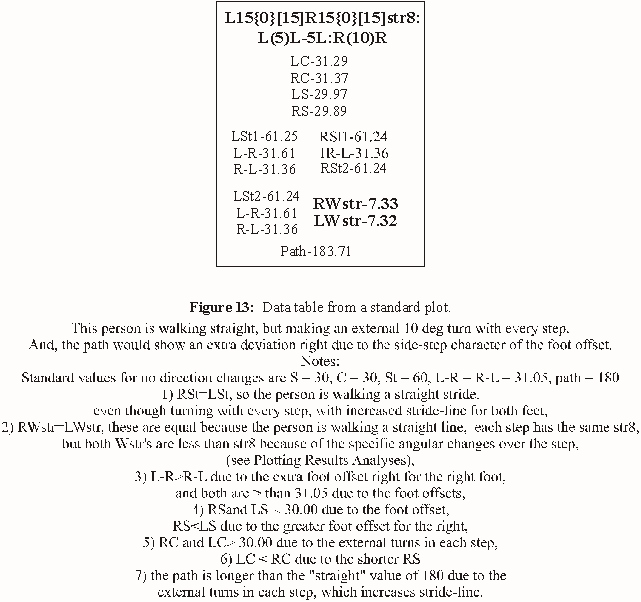
Dimensioning yields the distances between relevant heel-points. A table
such as the one below is the result.
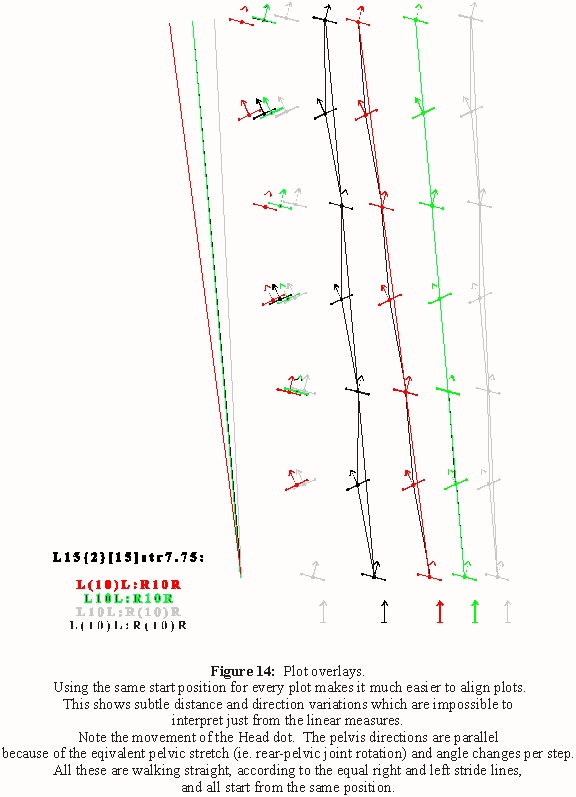
To manipulate the path, select all the footfalls in a plot then group.
Since the start footfall is identical for all the plots, they can be
overlaid to show subtle elements of path deviation impossible to see
otherwise.
Previous
Next
|

